
Captiva Island Real Estate Market Analysis 2026
- Josh Wheeler
- 9 hours ago
- 9 min read

Captiva Island sits at a rare intersection of natural beauty and real estate scarcity that sets it apart from virtually every other Florida coastal market. If you are doing a captiva island real estate market analysis right now, you are navigating a market shaped by fewer than 500 residential parcels, post-Hurricane Ian rebuilding dynamics, and some of the most significant flood insurance cost shifts in Florida’s recent history. This guide walks you through the fundamentals, the data sources that actually matter, and the step-by-step evaluation process you need before committing capital to this island.
Table of Contents
Key Takeaways
Point | Details |
Scarcity drives pricing | Captiva has fewer than 500 residential parcels, creating a premium that persists even during corrections. |
Local MLS data is non-negotiable | National indexes smooth out price swings that SCIAR’s MLS data captures in real time. |
Insurance costs can make or break deals | Gulf-front flood insurance can run $15,000 to over $30,000 annually, so model this before negotiating price. |
Post-Ian property status matters | Rebuilt and elevated properties command premiums while damaged properties trade at discounts, creating a split market. |
Patience is a strategy | Captiva’s thin market rewards buyers who understand seasonal cycles and wait for the right entry point. |
Captiva Island real estate market analysis: the fundamentals
Captiva’s market does not behave like a typical Florida coastal town. The island’s permanent population sits between 175 and 600 people, with the majority of residents living there only part of the year. That small, seasonal population creates a market where a handful of closed sales in any given month can move the median price by a meaningful percentage. It is the definition of a thin market.
This thinness is both a risk and an opportunity. Captiva’s micro-market segmentation leads to volatile price trends compared to national averages, so a single outlier sale can distort monthly data in ways that obscure the underlying trend. Understanding this context is the first thing any serious buyer or investor needs to internalize.
The market also segments clearly by waterfront type. Segmenting properties by waterfront type and development status is critical for meaningful valuation comparisons. Gulf-front properties along the western shore carry the highest price points and the most dramatic rental income potential. Canal-front and bayfront homes on the eastern side offer boat access, calmer waters, and generally lower entry prices, though they still reflect the island’s scarcity premium.
The current average home value on Captiva is approximately $1,204,096, down 10% year-over-year. That correction is not a market collapse. It reflects the post-Ian repricing process, insurance cost pressures, and the natural digestion of a surge in elevated rebuilds coming to market.
Pro Tip: Do not treat that 10% decline as a discount signal on its own. You need to understand whether the specific property you are evaluating is in the rebuilt segment trading at a premium or the damaged segment trading at a discount. Those two categories are moving in opposite directions.
Essential data sources for your market analysis
The most common mistake investors make when researching Captiva is leaning on national real estate indexes. Those tools are built for high-volume markets. They aggregate thousands of transactions to find trends. Captiva might see a dozen closed sales in a quiet month. The aggregation obscures more than it reveals.
MLS data from SCIAR is the most reliable source for current market activity and sales on Captiva and Sanibel. SCIAR releases monthly market reports that track median sale prices, days on market, active inventory, and closed sales volume. These reports give you the granular, local picture that national indexes cannot provide.
Here is the data framework you should build before making any offer:
Median sale price by property type. Track Gulf-front, canal-front, and interior separately. A blended median can mislead you entirely.
Days on market by segment. Rebuilt, elevated properties and distressed, damaged ones sit on the market for very different durations. Knowing this tells you about buyer confidence in each category.
Active inventory versus closed sales ratio. On a thin market like Captiva, a ratio above 6 months of supply signals a buyer’s window. Below 3 months means you should expect competition.
Year-over-year price movement by tier. The bottom-tier home value index dropped 13.34% year-over-year as of early 2026, while premium rebuilt Gulf-front properties held value far better. That split is critical to your strategy.
Closed sales volume trends. Rising closed sales with stable or tightening inventory signals a recovering market. Falling closed sales with rising inventory signals the opposite.
Metric | What it tells you | Best source |
Median sale price | Overall market direction | SCIAR monthly MLS report |
Days on market | Buyer demand and urgency | SCIAR monthly MLS report |
Active inventory | Supply pressure on pricing | Local MLS via broker |
Flood insurance costs | True carrying cost | Florida-licensed insurance broker |
Bottom-tier ZHVI trend | Entry-level segment health | Zillow ZHVI city-level data |
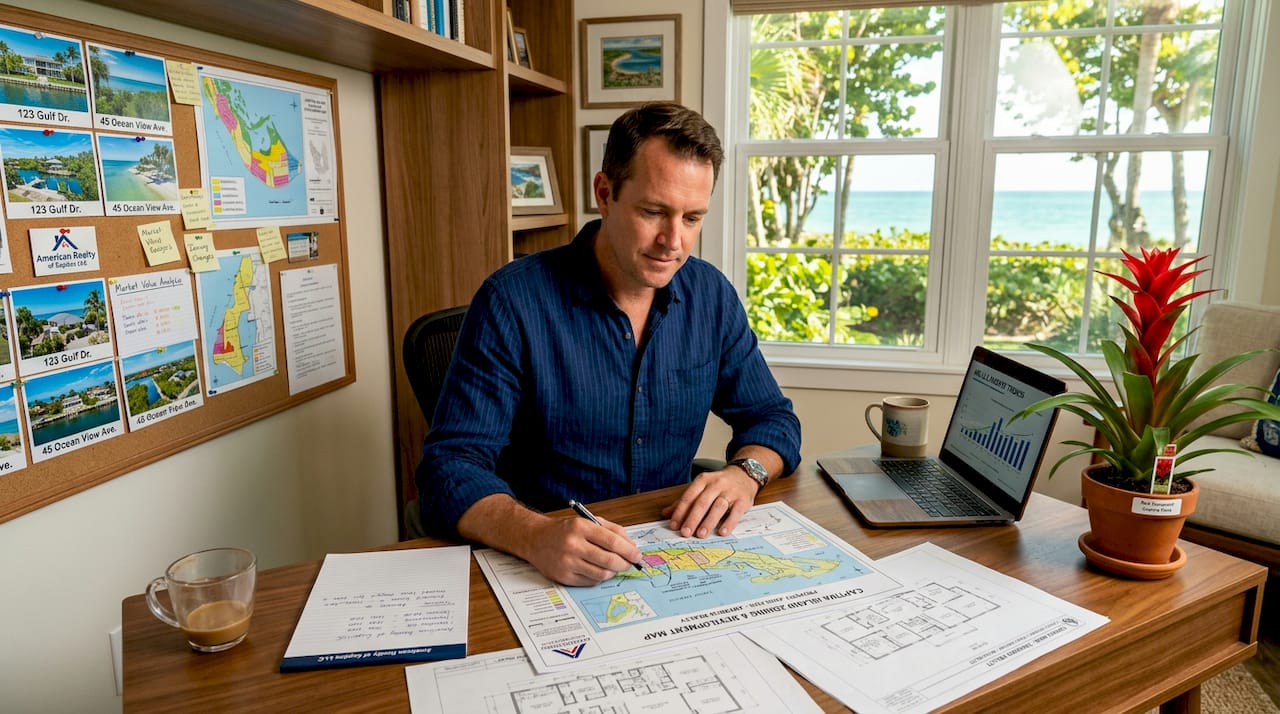
Evaluating Captiva Island properties: a step-by-step approach
Once you have the market context, the property-level evaluation is where deals are made or broken. Captiva’s specific geography and post-Ian environment require a more thorough diligence process than most Florida markets.
Step 1: Verify elevation and flood zone status before everything else. Elevation, flood zone, and rebuilding status directly impact underwriting and insurance costs on Captiva. A property in AE or VE flood zones with low elevation will carry dramatically higher insurance costs than one elevated to current FEMA standards. Get the elevation certificate before you spend time on anything else.
Step 2: Understand the full insurance cost stack.Underwriting costs must include flood, windstorm, hurricane, and HOA insurance where applicable to accurately model carrying costs. For Gulf-front properties specifically, flood insurance alone can run $15,000 to over $30,000 annually. Add windstorm coverage and your annual insurance outlay on a premium beachfront home can approach $50,000. Model this number before you negotiate price.
Step 3: Determine rebuild and compliance status. Hurricane Ian created a clear split in the Captiva market. Rebuilt and elevated properties command premiums while damaged properties trade at discounts. A rebuilt home with modern pilings, hurricane-impact glass, and current code compliance is a fundamentally different asset than a pre-Ian structure still awaiting repair. Each requires a different offer price, a different insurance model, and a different investment thesis.
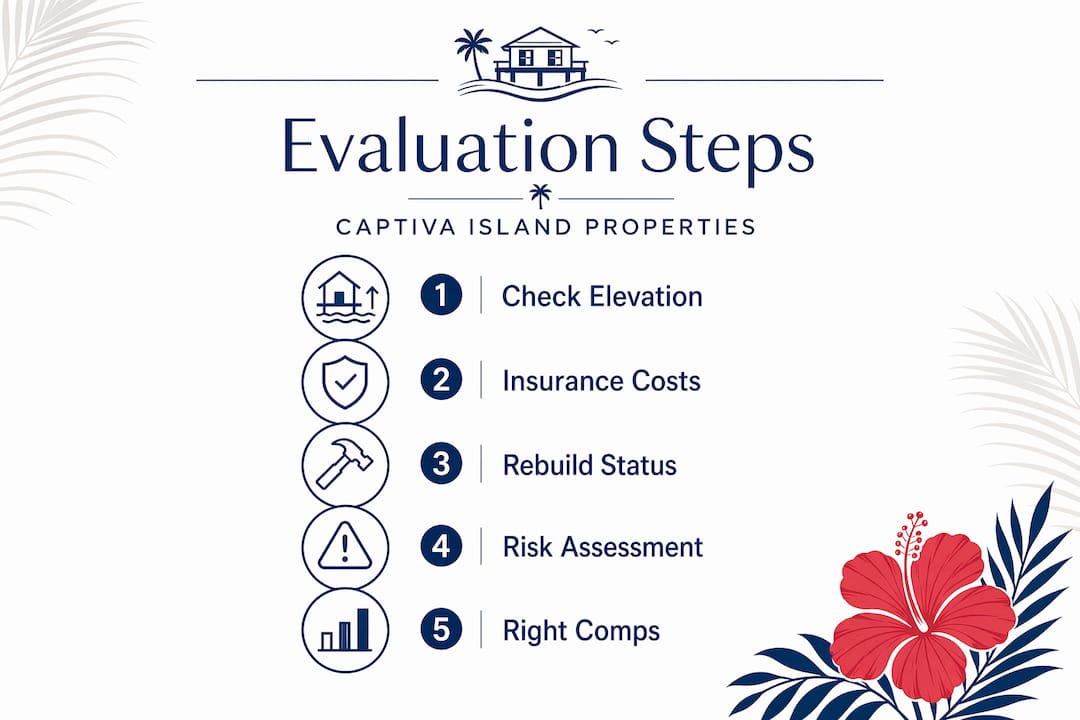
Step 4: Commission an engineering and coastal risk assessment. This is not optional on a barrier island. A licensed structural engineer familiar with Florida coastal construction can identify deferred maintenance, code deficiencies, and storm vulnerability that a standard home inspection will miss. Budget $1,500 to $3,000 for this step. It is far less expensive than discovering foundation issues after closing.
Step 5: Compare your target property to the right comps.
Property type | Typical price range (2024-2026) | Key investment driver |
Gulf-front rebuilt/elevated | $3.5M to $8M+ | Premium rental income, scarcity, appreciation |
Gulf-front damaged/unrebuilt | $1.5M to $3M | Discount entry, higher risk, rebuilding cost exposure |
Canal-front/bayfront | $800K to $2.5M | Boat access, lower insurance tiers, steady rental demand |
Interior parcels | $500K to $1.2M | Lower price point, reduced insurance costs, less rental upside |
Gulf-front homes in premium areas like Andy Rosse Lane rebounded quickly after the storm, with listing prices between $3.5M and $8M for rebuilt homes in 2024. That recovery was not random. It reflects the permanent scarcity of true Gulf-front inventory on an island where no new land is being created.
Pro Tip: If you are weighing a canal-front home against a Gulf-front property, run the rental income projections on both using actual booking data from the Captiva market. Beachfront rental properties consistently outperform in peak season, but the gap narrows considerably in shoulder months when canal-front homes attract boating families.
Common mistakes to avoid in this market
Captiva rewards diligent buyers and punishes assumptions. The mistakes investors make here are often the same ones that work fine in larger markets but become costly on a small island.
Underestimating carrying costs is the most common error. FEMA’s Risk Rating 2.0 has increased flood insurance premiums significantly across Florida in 2026, with typical annual premiums running 18% or more above prior-year levels, and the glide path continues upward. Investors who modeled insurance costs using two-year-old data are now holding properties with negative cash flow they did not anticipate.
Relying on national real estate indexes is another trap. A broad Florida real estate trends analysis may show moderate price growth statewide, but Captiva’s thin market can diverge sharply from that picture in any given quarter.
Ignoring micro-market differences is particularly risky here. A property one street back from the Gulf does not simply carry a modest discount compared to a beachfront address. It operates in a different market segment with different buyer pools, different rental income potential, and different resale liquidity. Treating the island as a single homogeneous market will produce inaccurate valuations every time.
Failing to verify that a rebuilt property was permitted and inspected to current code is the kind of oversight that creates a genuine title and insurance nightmare down the road. Always pull the permit history and confirm the certificate of occupancy before closing.
Neglecting seasonal demand fluctuations in rental income projections is also a recurring mistake. Captiva’s rental market is highly seasonal. Peak weeks in winter and spring can carry nightly rates three to four times higher than summer. Averaging annual income without accounting for that seasonality will produce an optimistic projection that the actual cash flow will not support.
Monitoring Captiva Island market trends over time
Buying on Captiva is not a one-time analysis exercise. The market shifts seasonally, and post-Ian recovery is still unfolding in ways that will create both risks and real estate investment advantages over the next several years.
Subscribe to SCIAR’s monthly market reports and review them consistently. Track the ratio of active listings to closed sales. Watch for months where inventory drops sharply. That often signals a seasonal buying surge from winter visitors who decide they want to own what they have been renting. Recognizing that pattern early gives you a meaningful advantage on negotiation timing.
Watch how rebuilt properties move through the market relative to unrebuilt ones. As the gap between those two categories narrows, it may signal that buyers are becoming more comfortable taking on renovation risk. That shift represents an opportunity for buyers willing to manage a rebuild project carefully. Monitoring Captiva Island property trends over consecutive months, rather than reacting to a single data point, is how you build a confident position in this market.
Local expertise matters here in a way it simply does not in larger markets. A real estate professional with deep knowledge of Captiva’s specific neighborhoods, permit history, and rental patterns will surface information that no database can provide. That relationship is part of your research infrastructure.
My honest take on investing in Captiva right now
I’ve watched buyers approach Captiva with the same mental model they use for buying in Naples or Sarasota, and I’ve seen that approach cost them real money. This is not a commodity market. It is a scarcity market. And scarcity markets require a different kind of patience.
What I’ve found is that the investors who do well here are the ones who accept that the right property at the right price may take twelve to eighteen months to find. They track the market consistently, they build relationships with local agents, and they are ready to move quickly when a rebuilt, properly elevated property comes to market at a realistic price.
My strongest conviction in this market right now is that rebuilt properties with modern elevation certificates and current code compliance are the right long-term bet. The insurance cost advantage of a properly elevated property compounds every year as FEMA’s Risk Rating 2.0 continues its upward trajectory for non-compliant structures. You are not just buying a home. You are buying a favorable insurance position relative to the rest of the island.
The mistake I see too often is buyers fixating on purchase price while underweighting carrying costs. On a $2M property, a $20,000 annual difference in insurance costs is a 1% yield differential that will matter enormously over a ten-year hold. Run those numbers honestly. And if you are buying for rental income, understand that Captiva’s rental income potential is genuinely strong during peak season but you need the full-year picture to know what you actually own.
— Josh
How Captiva-island helps you find the right property
If this analysis has clarified what you are looking for, the next step is seeing what is actually available on the island right now. Captiva-island, powered by over 30 years of local expertise through American Realty of Captiva, offers access to the full range of Gulf-front and canal-front properties across the island.

Whether you are evaluating luxury beachfront homes for personal use or researching rental income properties, the team at Captiva-island brings the kind of localized knowledge this market demands. You can explore available rental and ownership listings directly, or connect with a local expert who understands the post-Ian rebuild landscape, flood zone nuances, and seasonal rental dynamics that shape every sound investment decision on this island. The water is warm and the inventory is limited. The right time to start looking is now.
FAQ
What makes Captiva Island’s real estate market unique?
Captiva has fewer than 500 residential parcels and a permanent population under 600, creating extreme scarcity that drives premium pricing and volatile micro-market conditions unlike any typical Florida coastal market.
How much does flood insurance cost on Captiva Island?
Flood insurance for Gulf-front properties on Captiva can range from $15,000 to over $30,000 annually, and those costs continue rising under FEMA’s Risk Rating 2.0 program. Buyers must model this cost before negotiating any purchase price.
What is the average home value on Captiva Island in 2026?
The average home value is approximately $1,204,096, down about 10% year-over-year, reflecting post-Hurricane Ian repricing and rising insurance costs rather than a fundamental collapse in demand.
Should I buy a rebuilt or damaged property on Captiva?
Rebuilt and elevated properties carry higher prices but lower insurance costs and less risk. Damaged properties trade at discounts but require careful assessment of rebuilding costs, current code compliance requirements, and permitting history before any offer.
Where can I find reliable Captiva Island market data?
SCIAR’s monthly MLS market reports are the most accurate source for Captiva-specific sales activity, median prices, and inventory levels. National indexes lack the transaction volume needed to reflect this thin market accurately.
Recommended


Comments