
How Beach Property Demand Trends Work in 2026


Beach property demand trends are defined by the intersection of fixed coastal supply, seasonal tourism cycles, and shifting buyer priorities that make these markets behave unlike any other real estate category. Coastal land cannot be manufactured. That physical constraint creates a pricing floor that inland markets simply do not share. Understanding how beach property demand trends work gives investors a real edge, because the signals are readable once you know what to measure. Captiva-island has spent over 30 years watching these patterns play out on one of Florida’s most sought-after barrier islands, and the fundamentals have only grown sharper.
How beach property demand trends work: scarcity and location premiums
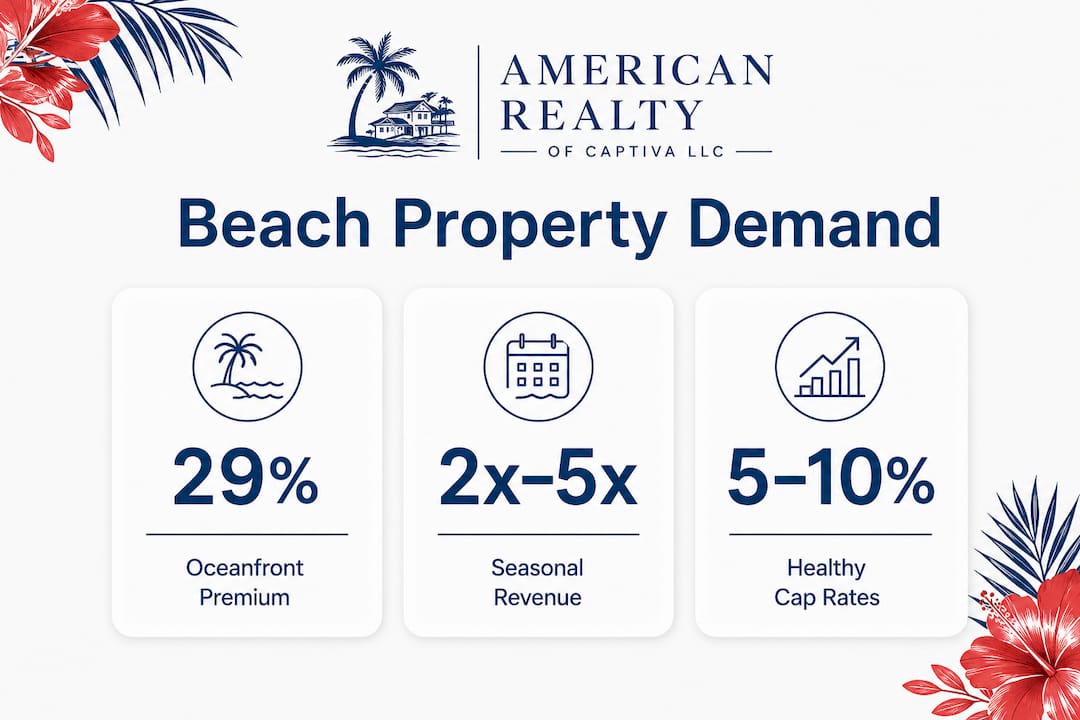
Coastal scarcity is the single most powerful force in beach real estate demand factors. Oceanfront homes command a 29% price premium over comparable inland properties in the same market. That gap is not arbitrary. It reflects the simple fact that no developer can build more shoreline.
The premium escalates dramatically in supply-constrained global markets. In Dubai, seafront premiums rose from 90% to 128% between 2021 and Q1 2026 as available waterfront inventory tightened. That 38-percentage-point increase over five years tells you what happens when demand grows faster than supply can respond. The same logic applies to barrier islands like Captiva, where developable beachfront lots are genuinely finite.
Location within a coastal market matters as much as the market itself. View corridors and walkability create what analysts call “psychological exclusivity,” and properties separated from the beach by even one street suffer disproportionate price drops. A home with unobstructed water views commands a different buyer psychology than one where you glimpse the ocean between two buildings. Investors who treat “near the beach” and “beachfront” as interchangeable categories consistently overpay for the wrong asset.

Pro Tip: When evaluating a coastal property, walk the site at high tide and verify that no future construction can block the view corridor. A protected sightline is worth more than square footage.
The supply picture will tighten further. New premium waterfront units in Dubai are projected to fall from 4,261 in 2026 to just 848 by 2031. That trajectory mirrors what mature coastal markets in the U.S. have already experienced. Understanding why beachfront property appreciates faster than inland real estate starts with this supply math.
How does tourism seasonality shape beach rental income?
Seasonal demand for beach homes creates revenue swings that annual averages completely hide. U.S. coastal vacation rental markets show peak-to-trough revenue ratios of 2x to 5x, meaning a property that earns $10,000 in july may earn $2,000 in january. Relying on annual averages to evaluate a rental investment is like reading a weather report for the whole year and packing accordingly.
Markets like Panama City Beach and Breckenridge illustrate this clearly. Both show strong annual revenue numbers, but month-by-month analysis reveals that the top three months often generate more than half of total annual income. That concentration creates real cash flow risk if a property sits vacant during peak weeks due to poor marketing or pricing strategy.
The most effective operators use dynamic pricing and track booking lead times as forward-looking demand signals. A property that fills its peak calendar eight weeks in advance is performing differently from one that fills it two weeks out, even if the nightly rate looks similar. Peak beach rental season analysis is not optional for investors. It is the foundation of any honest income projection.
Key metrics that reveal true seasonal rental demand include:
Monthly revenue breakdown across at least two full calendar years, not just annual totals
Occupancy rate by month, normalized to remove owner-use weeks from the denominator
Average daily rate (ADR) by season, showing whether the operator captured peak pricing or left money on the table
Booking lead time trends, which signal whether demand is strengthening or softening in a given season
Channel mix, since direct bookings carry lower fees and often indicate a loyal repeat-guest base
Pro Tip: Ask sellers for their channel manager export, not just a summary income statement. Raw booking logs reveal gaps, cancellations, and pricing patterns that summaries conceal.
How should investors analyze beach rental cap rates?
Cap rate analysis in coastal markets requires more discipline than in standard residential investing. Beach rental cap rates must account for occupancy gaps, expense assumptions, and seasonal volatility to avoid overestimating income. A seller’s stated cap rate almost always reflects best-case assumptions. Your job is to stress-test every line.
Top-performing U.S. short-term rentals share three traits: superior design, disciplined pricing, and strong review velocity. Cap rates of 5–10% are considered healthy in supply-constrained coastal markets. That range is tighter than many investors expect, but it reflects the asset quality and appreciation potential built into beachfront pricing.
A rigorous assessment of any beach rental investment follows these steps:
Validate historical booking logs. Request raw data from the property management system, not a summary. Cross-reference with tax records where short-term rental taxes are reported monthly.
Normalize occupancy. Remove owner-use weeks and any periods the property was off-market for renovation. Calculate true market occupancy.
Rebuild the expense stack. Management fees, HOA dues, insurance, maintenance reserves, and platform fees often add up to 40–50% of gross revenue in coastal markets.
Model three scenarios. Run conservative (10% below historical occupancy), expected (historical average), and upside (10% above) cases. The conservative scenario is your floor for financing decisions.
Assess micro-local factors. Zoning rules, HOA short-term rental restrictions, and local licensing requirements can change income potential overnight. Scenario modeling for beach rentals is the only way to manage regulatory risk responsibly.
Pro Tip: A lower cap rate in a supply-constrained beachfront market often signals stronger appreciation potential, not a weak deal. Evaluate total return, not yield alone.
The Florida luxury rental market offers a useful case study. Properties with private pools and direct beach access consistently outperform on both ADR and occupancy, because they serve a guest segment that books early and cancels rarely.
What trends are reshaping beach property demand in 2026?
Remote work and lifestyle migration have permanently altered the demand base for coastal properties. Post-COVID lifestyle shifts drove 56–79% land price appreciation in key coastal towns between 2020 and 2025, as retirees and remote professionals relocated from urban centers. This is not a temporary trend. It is a structural shift in who buys beach property and why.
The definition of luxury in coastal markets has changed alongside this migration. 48% of high-net-worth buyers now cite proximity to seawater as their primary luxury marker, ranking it above prestige address, architectural design, or brand affiliation. That shift has direct implications for how you price and position a coastal asset.
Luxury in coastal markets is no longer defined by the size of the lobby or the name above the door. It is defined by the quality of the view from the bedroom window and the ease of walking barefoot to the water. Buyers in 2026 are paying for access, calm, and the feeling that the outside world is genuinely far away.
Wellness and mental health benefits now factor explicitly into purchase decisions. Buyers articulate the restorative value of water proximity in ways that were rare a decade ago. This gives well-located beach properties a demand driver that transcends the investment thesis. You can read more about how choosing the right holiday home connects lifestyle priorities to property selection.
What risks affect beach property demand and prices?
Erosion risk is the most underpriced factor in coastal real estate analysis. Elevated plots with verified resilience increasingly command premium pricing as buyers and lenders apply climate risk assessments to coastal assets. A property that sits two feet higher than its neighbor may carry meaningfully lower insurance costs and a longer useful life.
Infrastructure limitations and title delays suppress growth in emerging coastal markets. Investors who move quickly without verifying utility access, road quality, and clear title often find that their timeline and budget assumptions collapse. These are not exotic risks. They are standard due diligence items that get skipped when buyers fall in love with a view.
Regulatory changes affecting short-term rentals represent a growing threat in established markets. Several Florida municipalities have tightened licensing requirements and occupancy limits for vacation rentals in recent years. A property that generates strong rental income today may face restrictions that reduce its income potential within a single ownership cycle.
Pro Tip: Build resilience into your valuation by requesting a FEMA flood zone determination, a title search with lien history, and a copy of the current local short-term rental ordinance before making any offer.
Key Takeaways
Beach property demand is driven by fixed coastal supply, seasonal revenue cycles, and lifestyle-driven buyer priorities that together create pricing dynamics unlike any other real estate category.
Point | Details |
Scarcity drives premiums | Oceanfront homes command a 29% price premium over inland properties in the same market. |
Seasonality distorts averages | Peak-to-trough revenue ratios of 2x–5x make month-by-month analysis the only reliable income measure. |
Cap rates need stress-testing | Validate booking logs, normalize occupancy, and model three scenarios before accepting any seller income claim. |
Lifestyle migration is structural | Remote work and wellness priorities have permanently expanded the buyer base for coastal properties. |
Resilience adds value | Elevated plots with verified climate resilience and clear title command measurable pricing advantages. |
What I’ve learned watching coastal markets tighten
The conventional wisdom says beach property is a safe, appreciating asset. That is true, but it is incomplete. The investors I’ve seen get hurt in coastal markets were not wrong about the direction of prices. They were wrong about the timeline and the specific asset they chose.
A property that is two streets from the water in a market where true beachfront is scarce will not track beachfront appreciation. It will track the inland market with a slight premium. That distinction costs investors years of compounding. The gap between “near the beach” and “on the beach” is not a matter of preference. It is a matter of which supply constraint you are actually buying into.
The other pattern I keep seeing is investors who accept seller income data at face value. Coastal rental income is highly manageable by the seller in the final 12 months before a sale. Occupancy can be inflated by pricing below market. ADR can be inflated by cherry-picking peak weeks. The only honest picture comes from raw booking data normalized over at least two full years.
The trends shaping demand in 2026, including lifestyle migration, wellness priorities, and tightening supply, are real and durable. But they reward investors who do the work. The beach will always be beautiful. The question is whether the numbers behind the property are as solid as the view.
— Josh
Beachfront rentals on Captiva Island worth exploring
Captiva-island’s beachfront and pool rental listings represent exactly the kind of supply-constrained, premium-access inventory that the demand trends in this article describe. American Realty of Captiva has managed these properties for over 30 years, which means the booking histories are real, the income data is verifiable, and the local knowledge runs deep.

Captiva Island sits at the intersection of every demand driver discussed here: finite beachfront land, strong seasonal rental performance, and a guest base that prioritizes water access above all else. If you want to see how these market principles translate into actual beachfront homes with pools and direct Gulf access, the listings are a practical next step.
FAQ
What is the average price premium for oceanfront homes?
Oceanfront homes command roughly 29% more than comparable inland properties in the same market, with premiums reaching 128% in highly supply-constrained markets like Dubai.
How does seasonality affect beach rental income?
Coastal vacation rentals show peak-to-trough revenue ratios of 2x to 5x, meaning annual income averages can significantly misrepresent a property’s true cash flow profile.
What cap rate is healthy for a beach rental property?
Cap rates of 5–10% are considered healthy in supply-constrained coastal markets, provided the underlying occupancy and expense assumptions have been independently validated.
Why are lifestyle shifts important for forecasting beach property trends?
Remote work and wellness priorities have structurally expanded the buyer base for coastal properties, driving sustained demand beyond traditional vacation and retirement demographics.
How do I reduce risk when buying beach property?
Request a FEMA flood zone determination, a full title search, raw booking logs from the rental history, and a copy of the current local short-term rental ordinance before committing to any coastal purchase.
Recommended
Comments